You know what's actually painful? Spending your Tuesday morning copying numbers from five different platforms into a spreadsheet, formatting it nicely, and emailing it to your team. Then doing it again next Tuesday. And the Tuesday after that.
Automated email reporting fixes this exact problem.
It pulls your data automatically, packages it into readable reports, and delivers them to your inbox (or your boss's inbox) on schedule. No manual work. No copying and pasting. No "forgot to send the weekly report" panic at 4:45pm on Friday.
The global email marketing market was valued at USD 13.72 billion in 2026, and automation is a major reason why. When you can set up reports once and have them run forever, you free up hours every week for actual strategy work.
Global email marketing market valued at $13.72B (2026)—momentum fueled by automation.
We're going to show you exactly what automated email reporting is, how to set it up, which metrics actually matter, and how to build dashboards that give you real insights instead of just pretty charts. By the end, you'll know how to stop being a human copy-paste machine and start getting data delivered to you automatically.
What Email Reporting Automation Actually Means
Email reporting automation is a workflow that pulls data from your systems, formats it into reports, and sends those reports via email without you touching anything.
Instead of manually running reports every Monday, you set up the automation once. The system then generates and sends reports on whatever schedule you choose.
The key difference from manual reporting is consistency. Automated reports run at exactly the same time, include exactly the same metrics, and get delivered to exactly the same people every single time. No variation based on who remembers to do it or how busy they are.
Most marketing teams use automated reporting for weekly performance summaries, monthly campaign results, or real-time alerts when metrics hit certain thresholds. Sales teams use it for pipeline updates and conversion tracking. Finance teams use it for budget monitoring and expense reports.
The workflow typically connects three components: your data source (like Mailchimp, Salesforce, or Google Analytics), your reporting tool (which formats the data), and your email delivery system (which sends it to stakeholders).
The Core Components That Make Automation Work
Every automated email report needs three things working together.
First, data integration. Your reporting system needs permission to access your data sources. This usually happens through API connections or direct integrations. HubSpot, for example, connects directly with most major email platforms and CRMs.
Second, report configuration. You decide which metrics to include, how to format them, and what timeframe to cover. Some teams want high-level summaries. Others need detailed breakdowns by campaign or channel.
Third, delivery scheduling. You set when reports get sent and who receives them. Daily at 8am for your CEO. Weekly on Monday morning for the marketing team. Monthly on the first of each month for board members.
Once these three pieces are configured, the system runs on autopilot. Your only job is checking the reports when they arrive and acting on the insights.
Manual vs Automated Reporting Reality Check
Manual reporting takes time. A lot of time.
If you're logging into three platforms, exporting data, combining it in a spreadsheet, formatting it, and emailing it to five people, you're probably spending 30-45 minutes per report. Do that weekly and you've burned through 2-3 hours every month on copy-paste work.
Automated reporting takes 30-60 minutes to set up initially, then runs forever with zero ongoing time investment. The math is pretty straightforward.
Manual reports also introduce human error. Someone forgets to pull the data. Someone copies the wrong week's numbers. Someone sends last month's report with this month's date. We've all been there.
Automated reports eliminate these mistakes. The system pulls the same data the same way every single time.
There's also the consistency benefit. Manual reports vary based on who creates them and how much time they have. Automated reports look identical every time, making it easier to spot trends and compare performance across periods.
How Automated Email Reporting Actually Works
Now that you understand what automated reporting is, here's how it actually functions behind the scenes.
The process starts with data connectors. These are integrations that link your reporting tool to your data sources. Think of them as bridges between your email platform, CRM, analytics tool, or database and your reporting system.
Most modern reporting tools offer pre-built connectors for popular platforms. ActiveTrail, Klaviyo, and GetResponse all integrate directly with major reporting platforms. You authorize the connection once, and the tool can pull data automatically from that point forward.
The Data Collection and Processing Pipeline
Once connected, the system queries your data sources on schedule. If you've set up a weekly report, the tool pulls fresh data every week at the specified time.
The data gets processed according to your report configuration. The system calculates metrics like open rates, click rates, conversion rates, and revenue. It applies any filters you've set up (like specific campaigns or date ranges).
Then it formats everything into a readable report. This might be a simple HTML email, a PDF attachment, or a dashboard link. The format depends on what you've chosen and what your tool supports.
Finally, the system sends the report to your distribution list via email. Everyone gets the same report at the same time.
This entire pipeline runs without human intervention. Your only involvement is the initial setup and occasional adjustments when you want to change what's included or who receives it.
Scheduling Options and Trigger Conditions
Automated reports can run on fixed schedules or based on triggers.
Fixed schedules are straightforward. Daily at 6am. Every Monday at 9am. First day of each month. You set it once and reports arrive like clockwork.
Trigger-based reports respond to specific conditions. When daily email sends exceed 10,000. When conversion rate drops below 2%. When a campaign reaches 50% of budget. The system monitors these conditions and sends reports only when thresholds are met.
Some teams use both. Weekly scheduled reports for regular performance monitoring, plus triggered alerts for urgent situations that need immediate attention.
The best approach depends on your workflow. If your team has a Monday morning meeting to review performance, schedule reports for Monday at 8am. If you're monitoring a time-sensitive campaign, set up triggered alerts for key milestones.
Key Metrics That Actually Matter in Automated Reports
Not all metrics deserve space in your automated reports. Some matter. Most don't.
Focus on metrics that drive decisions. If knowing a number doesn't change what you do, it's clutter.
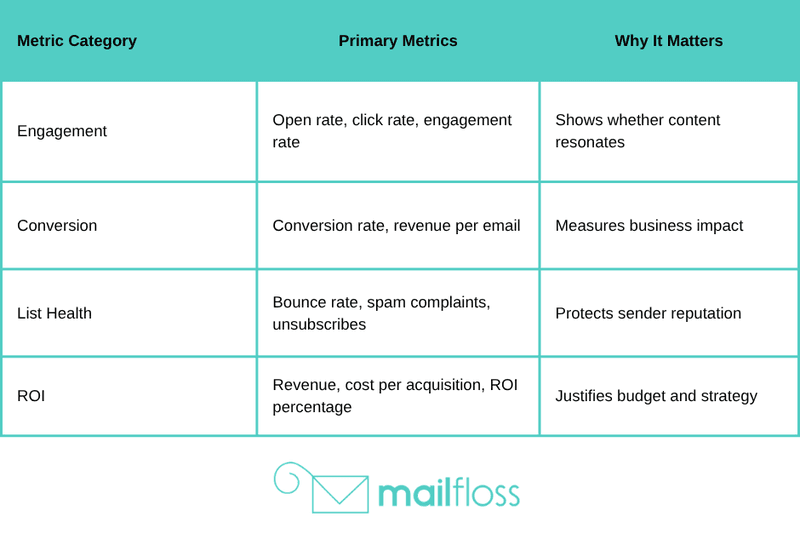
For email marketing, the essential metrics are open rate, click rate, conversion rate, and revenue per email. These tell you if people are engaging and if campaigns are making money.
Open rates show whether your subject lines work. Personalized subject lines achieve 26% higher open rates, which is why testing subject line variations matters so much.
Personalized subject lines drive 26% higher opens—optimize and A/B test them in your automated reports.
Essential Email Marketing Metrics for Automation
Click-through rate measures engagement beyond just opening. People might open your email out of curiosity, but clicking means genuine interest.
Conversion rate connects email activity to business outcomes. It doesn't matter if 1,000 people click if zero people buy. Track conversions to understand whether your emails actually drive revenue.
Revenue per email (or revenue per send) is the ultimate metric. It tells you exactly how much money each email generates. If you send 10,000 emails and generate $5,000 in sales, your revenue per email is $0.50.
List growth rate shows whether you're gaining or losing subscribers. A healthy email program grows its list over time. If you're hemorrhaging subscribers, something's wrong with your content or frequency.
Unsubscribe rate indicates content relevance. High unsubscribe rates mean you're annoying people or sending to the wrong audience. Low rates mean you're providing value.
Deliverability and List Health Indicators
Bounce rate shows list quality. Hard bounces (permanent delivery failures) indicate invalid addresses. Soft bounces (temporary issues) might resolve themselves, but consistent soft bounces often turn into hard bounces.
Spam complaint rate directly affects your sender reputation. Even a small percentage of spam complaints can land you in the junk folder for everyone. Monitor this closely and remove complainers immediately.
Engagement rate combines opens and clicks into a single metric. It's useful for comparing overall campaign performance across different sends or segments.
At mailfloss, we've seen how automated list cleaning improves all these metrics by removing invalid addresses before they cause deliverability problems. Our system runs over 20 checks on each address and fixes typos automatically, which keeps your reports showing healthy numbers instead of declining performance.
Campaign Performance and ROI Tracking
Campaign-level metrics help you understand what's working and what's not.
Track revenue by campaign to identify your most profitable email types. Welcome series might generate more revenue than weekly newsletters. Product announcement emails might outperform promotional discounts. You won't know unless you measure.
Cost per acquisition tells you how much you're spending to gain each customer through email. If you're spending $500 on list growth and acquiring 50 customers, your CPA is $10.
Return on investment is simple math. Revenue minus costs, divided by costs. If you generate $10,000 from a campaign that cost $500 to create and send, your ROI is 1,900%. Email marketing delivers $36-$45 ROI for every $1 spent, making it one of the highest-return channels available.
Email marketing delivers $36–$45 ROI for every $1—feature ROI on executive dashboards.
Segment performance comparison shows which audience segments engage most. Your existing customers might open at 35% while prospects open at 18%. This insight helps you allocate resources and tailor content.
Building Dashboards That Actually Provide Insights
A dashboard is only useful if it answers specific questions at a glance.
The mistake most people make is cramming every available metric into one screen. You end up with a chaotic mess of charts that looks impressive but tells you nothing.
Good dashboards have a clear purpose. An executive dashboard shows high-level KPIs like total revenue and growth trends. An operational dashboard shows daily metrics like send volume and deliverability rates. A campaign dashboard shows performance for specific initiatives.
Dashboard Design Principles That Work
Start with your most important metric prominently displayed. If revenue is what matters, put revenue at the top in the biggest font. Everything else supports or explains that primary number.
Use visual hierarchy to guide attention. Big numbers for key metrics. Smaller charts for supporting context. Color to highlight problems or wins.
Limit each dashboard to 5-7 key metrics. If you need more, create separate dashboards for different purposes or audiences.
Include comparison context. Showing this week's open rate means nothing without last week's rate or your benchmark goal. Always include comparison data so trends are visible.
Update frequency should match decision-making frequency. If you check performance weekly, daily updates create noise. If you're running a time-sensitive campaign, hourly updates might be necessary.
Real-Time vs Scheduled Dashboard Reports
Real-time dashboards update continuously as new data arrives. They're useful for monitoring active campaigns or tracking time-sensitive metrics.
The advantage is immediate visibility. You see problems as they happen. The disadvantage is constant distraction. Not every metric needs real-time monitoring.
Scheduled reports arrive at fixed intervals with data from specific timeframes. They're better for strategic analysis and consistent team communication.
Most teams need both. Real-time dashboards for campaign monitoring during launches or critical periods. Scheduled reports for regular performance reviews and stakeholder updates.
The key is matching the update frequency to the actual decision cycle. If you can't act on hourly data, don't receive hourly reports.
Customization Options for Different Stakeholders
Different people need different information.
Your CEO wants total revenue, growth rate, and high-level trends. They don't care about individual campaign click rates or subject line test results.
Your email marketing manager needs detailed campaign metrics, segment performance, and deliverability indicators. They need granular data to optimize tactics.
Your sales team wants lead quality metrics and conversion data. They care about which campaigns generate the most qualified leads, not overall open rates.
Create separate dashboard views for each stakeholder group. Same underlying data, different presentations focused on their specific needs and questions.
Most reporting tools let you configure multiple dashboards and email them to different distribution lists. Set this up once and everyone gets exactly what they need automatically.
Setting Up Your First Automated Email Report
Enough theory. Time to actually build something.
The setup process is simpler than most people expect. You can have your first automated report running in under an hour if you already have accounts with your data sources and reporting tool.
Step 1: Choose Your Reporting Platform
Pick a tool that integrates with your existing systems.
If you use HubSpot for email, their built-in reporting might be sufficient. If you use multiple platforms, you'll need a tool that can pull from all of them.
Popular options include Google Data Studio (free but requires technical setup), Tableau (powerful but expensive), and specialized email analytics tools that focus specifically on marketing metrics.
Check the available integrations before committing. If your reporting tool doesn't connect to your email platform, you're back to manual exports.
Step 2: Connect Your Data Sources
Navigate to your reporting tool's integration settings and connect your data sources.
This usually involves authorizing API access. The tool will ask you to log into your email platform and grant permission to read data. No data leaves your account without this explicit authorization.
For Mailchimp, this means clicking "Connect Mailchimp" and entering your credentials. For Salesforce, you'll grant OAuth access. For Google Analytics, you'll authorize your Google account.
The process takes 2-3 minutes per integration. Once connected, the tool can access your data whenever it needs to generate reports.
Step 3: Configure Your First Report
Start simple. Don't try to build the perfect report on your first attempt.
Select 3-5 metrics you actually check regularly. Open rate, click rate, conversion rate, and revenue are a solid starting point for email marketers.
Choose your timeframe. Weekly reports should cover the previous 7 days. Monthly reports should cover the previous calendar month. Make sure the timeframe matches your business rhythm.
Add any filters or segments you need. If you only want to see promotional campaigns (not transactional emails), filter by campaign type. If you manage multiple brands, filter by brand.
Configure the visual layout. Most tools offer templates. Pick one that's clean and readable. You can get fancy later.
Step 4: Set Up Your Delivery Schedule
Decide when reports should be sent and who should receive them.
For weekly reports, Monday morning before your team meeting is usually ideal. For daily reports, early morning before the workday starts gives people time to review.
Enter the recipient email addresses. Start with just yourself for testing. Once you confirm everything looks right, add your actual distribution list.
Most tools let you customize the email subject line and body text. Use clear subjects like "Weekly Email Performance Report" or "Campaign Results for [Campaign Name]".
Step 5: Test Before Going Live
Send yourself a test report before scheduling it for your whole team.
Check that all metrics are pulling correctly. Verify the numbers match what you see in your source platforms. Look for formatting issues or missing data.
Confirm the report actually answers the questions you need answered. If you're looking at it and still need to log into other tools to get information, revise the report.
Once you're satisfied, activate the schedule and add your full recipient list. The system will handle everything from that point forward.
Advanced Automation Features Worth Using
Once your basic automated reports are running, there are advanced features that can make them even more useful.
These aren't necessary for everyone, but they solve specific problems for teams with complex reporting needs.
Conditional Formatting and Alert Thresholds
Conditional formatting highlights problems automatically.
Set rules like "if open rate drops below 18%, display in red" or "if revenue exceeds $10,000, display in green". This makes issues immediately visible without manually scanning numbers.
Alert thresholds trigger notifications when metrics cross specific values. If your unsubscribe rate suddenly spikes to 2%, you get an immediate alert email instead of discovering the problem during your weekly review.
This is particularly useful for deliverability metrics. If your bounce rate jumps from 1% to 5%, you need to know immediately so you can investigate before it damages your sender reputation.
Predictive Analytics Integration
Some advanced reporting tools include predictive analytics that forecast future performance based on historical trends.
Predictive analytics in email marketing forecasts with 92% accuracy, helping you anticipate problems before they happen and identify opportunities early.

Predictive analytics can forecast email outcomes with 92% accuracy—use it to anticipate trends and act earlier.
These tools might predict that your current growth rate will get you to 50,000 subscribers by Q3, or that your engagement trend suggests a deliverability issue is developing.
Predictive features work best when you have at least several months of historical data. The more data available, the more accurate the predictions.
Cross-Platform Data Consolidation
If you're using multiple platforms, consolidated reporting shows the complete picture in one place.
Instead of checking Mailchimp for email metrics, Google Analytics for website behavior, and Salesforce for sales data, you see everything in one report.
This is where automated reporting shows its real power. Manual consolidation would take hours. Automated consolidation happens instantly.
The technical setup is more complex because you're connecting multiple data sources and defining how they relate to each other. But once configured, you get a unified view of your entire funnel from email send to final sale.
Common Automated Reporting Use Cases
Different teams use automated email reporting in different ways. Here are the most common scenarios we see.
Marketing Team Performance Monitoring
Marketing teams typically run weekly automated reports covering all email campaigns sent during the previous week.
These reports include standard engagement metrics plus campaign-specific KPIs. A product launch campaign tracks pre-orders. A webinar promotion tracks registrations. A content newsletter tracks article clicks.
The marketing manager reviews the report each Monday morning and adjusts the upcoming week's strategy based on what worked and what didn't.
Some teams also set up automated competitive benchmarking reports that compare their metrics to industry averages, helping them understand whether 22% open rate is good or needs improvement.
Executive Leadership Dashboards
Executives need high-level summaries, not granular details.
Monthly automated reports for leadership typically show total email revenue, month-over-month growth, subscriber count trends, and ROI. That's it.
The format is usually a single-page dashboard with big numbers and simple trend charts. No tables full of data. No detailed breakdowns by campaign type.
These reports answer the question "Is email marketing contributing to business growth?" If the answer is yes, executives are satisfied. If the answer is no, they dig deeper.
Sales Team Lead Quality Reports
Sales teams care about leads generated through email campaigns.
Automated lead reports show how many leads came from each campaign, what their quality scores are, and how quickly they're being followed up on.
This creates accountability. If marketing sends 200 leads and sales only contacts 50, the report makes that visible. If certain campaign types consistently generate high-quality leads, the report highlights that pattern.
Many teams include sales conversion data in these reports, connecting email campaigns all the way through to closed deals and revenue.
Client Reporting for Agencies
Marketing agencies use automated reporting to keep clients informed without burning hours on manual report creation.
Client reports are typically monthly and include campaign summaries, performance metrics, insights about what worked, and recommendations for the next month.
Automated emails generate 320% more revenue than non-automated emails, which is exactly the kind of insight agencies include to demonstrate the value of their automation work.
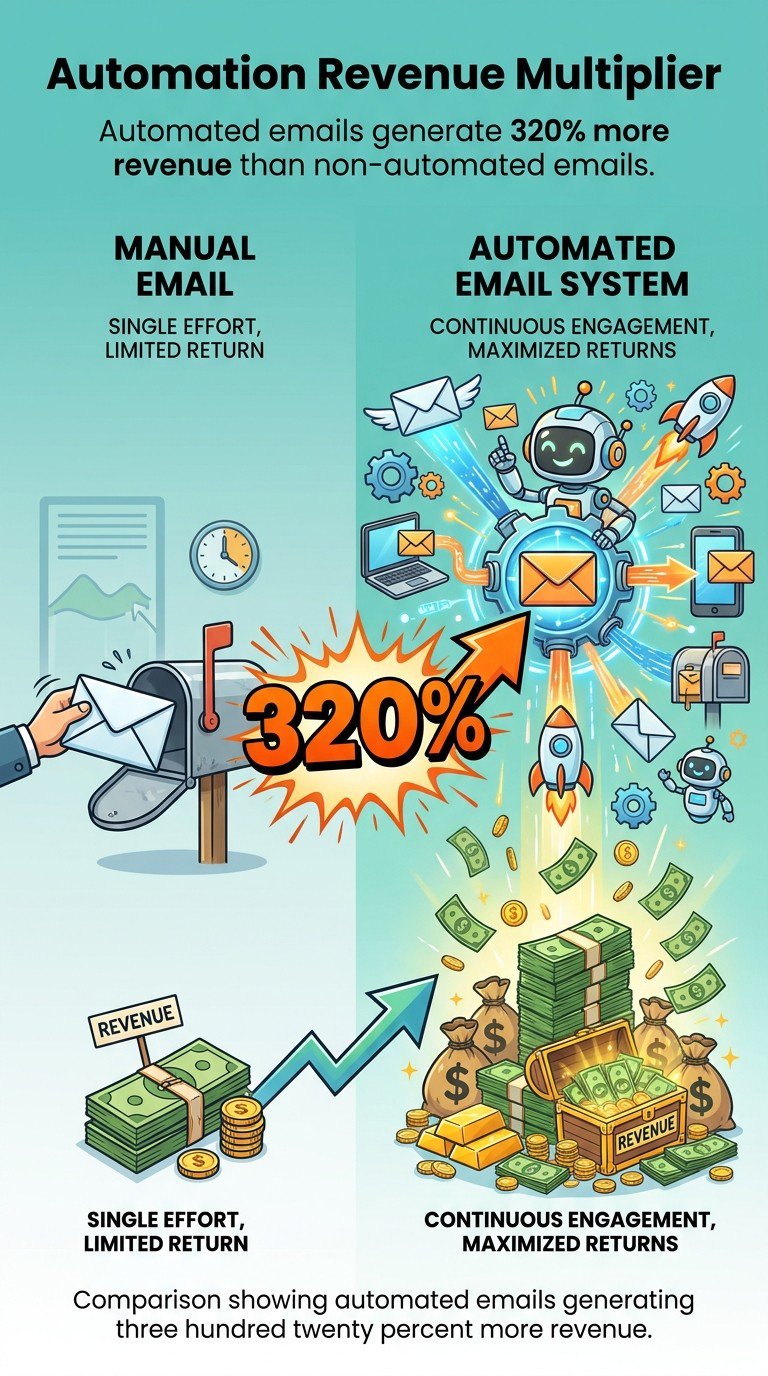
Automated emails generate 320% more revenue than non-automated—strong proof for client reporting.
The report goes out automatically to the client on the same day each month. The account manager reviews it beforehand to add any custom commentary, but the data compilation happens automatically.
Optimizing Report Content and Format
The most technically perfect automated report is useless if nobody reads it.
Report optimization focuses on making information scannable, actionable, and relevant to the specific audience receiving it.
Visual Design Best Practices
Use charts only when they communicate better than numbers. A trend over time makes sense as a line chart. A single percentage makes sense as a big number, not a pie chart.
Limit colors to a meaningful palette. Green for positive, red for negative, gray for neutral. Don't use twelve different colors just because they're available.
Include context with every metric. Show this week's open rate next to last week's rate and your target benchmark. Numbers without context are just numbers.
Use white space generously. Cramming information into every available pixel makes reports harder to read, not more informative.
Making Reports Scannable and Actionable
Start every report with a summary section. Three to five bullets highlighting the most important findings. Most recipients will only read this section.
Use clear section headers that describe what's in each section. "Campaign Performance" is vague. "Top 5 Campaigns by Revenue" is specific.
Include recommendations based on the data. Don't just show that Campaign A had a 12% click rate while Campaign B had an 8% click rate. Say "Campaign A's product focus drove higher engagement. Consider similar approaches for future sends."
Highlight anomalies automatically. If a metric changes by more than 20% week-over-week, call it out visually so it doesn't get missed.
Mobile-Friendly Report Formatting
Many people check reports on mobile devices, especially executives who read email on phones during commutes.
Use responsive design that adapts to screen size. Charts should reflow for narrow screens. Tables should remain readable without horizontal scrolling.
Keep summary sections at the top. Mobile readers won't scroll through three screens of charts to find the key takeaways.
Test your reports on actual mobile devices before finalizing the format. What looks perfect on a desktop monitor might be unreadable on a phone.
Troubleshooting Common Automation Issues
Automated reports occasionally break. Here are the most common problems and how to fix them.
Data Integration Problems
The most frequent issue is broken API connections.
This happens when authentication expires or when the source platform changes its API. Your report stops updating with fresh data, showing the same numbers week after week.
The fix is re-authenticating the connection. Go to your reporting tool's integration settings and reconnect the affected data source. This usually takes 30 seconds.
Some platforms require periodic re-authentication for security reasons. If your reports break every 90 days, it's probably an OAuth token expiration. Just reconnect when prompted.
Missing or Incorrect Metrics
Sometimes specific metrics stop appearing or show obviously wrong values.
This often happens after platform updates. The source system changes how it calculates or exposes a metric, breaking your report configuration.
Check the source platform's documentation for recent API changes. You might need to update your report configuration to use a new metric name or calculation method.
For calculation errors, verify your formulas. If you're calculating ROI as (revenue minus cost) divided by cost, make sure the fields haven't changed names or data types.
Delivery Failures
Reports that stop arriving in inboxes usually hit spam filters or bounce due to invalid recipient addresses.
Check your reporting tool's delivery logs. They'll show whether emails are being sent successfully or bouncing.
If reports are landing in spam, the issue is usually authentication. Make sure your reporting tool is sending from a verified domain with proper SPF and DKIM records.
If specific recipients aren't receiving reports, verify their email addresses are correct and their inboxes aren't full.
Measuring the ROI of Your Reporting Automation
How do you know if automated reporting is actually worth the effort?
Track the time savings first. Calculate how many hours per week you spent on manual reporting before automation. Multiply by your hourly cost. That's your baseline expense.
Compare that to the cost of your automation tool plus setup time. Most teams break even within the first month and see pure savings afterward.
Time savings are obvious, but there are less tangible benefits too.
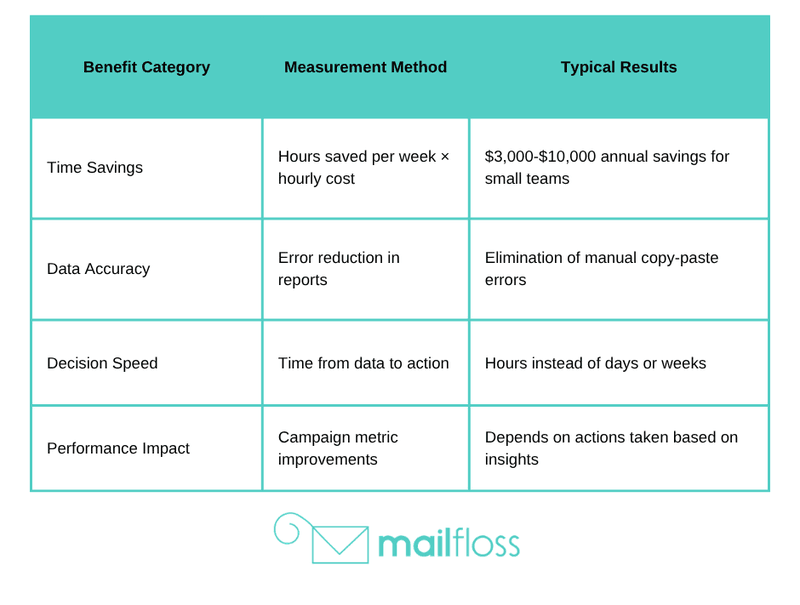
Quantifying Time Savings and Efficiency Gains
If manual reporting took 2 hours per week, automation saves 104 hours per year. At a $50/hour rate, that's $5,200 in annual savings from a tool that might cost $500-1,000 per year.
But the real value is what you do with those 104 hours. If you spend them on strategy work that improves campaign performance by even 5%, the revenue impact far exceeds the direct time savings.
Track decision velocity too. How quickly do you spot problems and react? With manual reporting, you might notice a deliverability issue a week after it starts. With automated alerts, you catch it the same day.
Improved Decision-Making Through Better Data
Consistent, reliable data improves decision quality.
When you have automated reports showing clear trends, you make decisions based on actual performance rather than gut feel or the last campaign you remember.
This is particularly valuable for optimization decisions. Should you send emails on Tuesday or Thursday? Test both and let the automated reports show you which performs better over multiple weeks.
Better decisions compound over time. A 5% improvement in conversion rate doesn't sound dramatic, but applied to every campaign over a year, it adds up to significant revenue growth.
For teams managing email list management automation, combining automated reporting with automated list cleaning creates a complete system where data quality directly feeds into better performance metrics without manual intervention.
Taking Your First Steps with Automated Reporting
You've got the knowledge. Now use it.
Start with one simple report this week. Pick your most important email metrics, connect them to a reporting tool, and schedule weekly delivery to yourself.
Watch it run for a month. See which insights you actually use and which metrics you ignore. Adjust based on what you learn.
Once your first report is running smoothly, add a second one for a different audience or purpose. Build your automation ecosystem gradually rather than trying to automate everything at once.
The teams seeing the biggest benefits from automated reporting aren't necessarily using the fanciest tools or tracking the most metrics. They're using simple reports consistently and acting on what they learn.
Automation works when you set it up and trust it to run. Manual reporting fails when you're too busy to do it properly. That's the difference.
If you're ready to improve your email performance beyond just reporting, check out our guide on how to improve email marketing for strategies that complement the insights you'll get from automated reports. And because clean data makes reports more accurate, our email bounce management guide shows you how to keep your list quality high so your metrics reflect genuine engagement rather than deliverability problems.
The sooner you automate your reporting, the sooner you stop wasting time on spreadsheets and start focusing on the strategy that actually grows your business.
No comments:
Post a Comment